Each year Anna conducts a poll among the children in a school in which she asks how many countries in Eastern Europe they know. The information from one poll has been used to estimate that during the first half of 2013, on average 5.25% of respondents could name at least 5 countries in Eastern Europe. Estimates for the years 2004 to 2017 are also provided, as shown in the accompanying table. 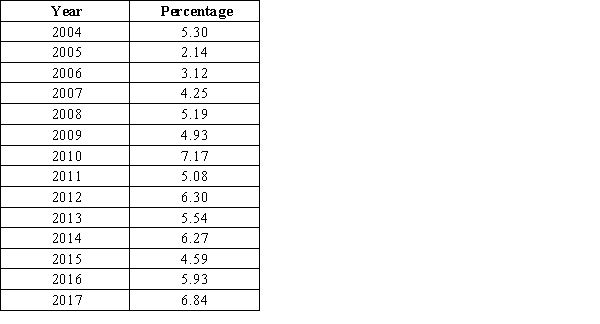 Having constructed a time series plot for these data, describe the trend in the percent of children who could name at least 5 countries in Eastern Europe over time.
A) The time series plot shows that the percentage has steadily increased year to year.
B) The time series plot shows that the percentage has not steadily increased year to year, although there does appear to be a general upward trend following the drop that occurred in 2005.
C) The time series plot shows that the percentage has not steadily decreased year to year, although there does appear to be a general downward trend following the rise that occurred in 2010.
D) The time series plot shows that the percentage has steadily decreased year to year.
Correct Answer:
Verified
Q15: The quantity Q16: In a scatter plot, both the horizontal Q17: For stem and leaf plots with single-digit Q18: A curve with tails that decline more Q19: Exhibit 3-4 There has been a recent Q20: The density of a class can be Q21: Consider the time series plot. Determine what Q23: A student conducted a survey among different Q24: As part of the United States Census, Q25: Exhibit 3-5 In birds, the muscles that![]()
Unlock this Answer For Free Now!
View this answer and more for free by performing one of the following actions

Scan the QR code to install the App and get 2 free unlocks

Unlock quizzes for free by uploading documents