Figure 8-5 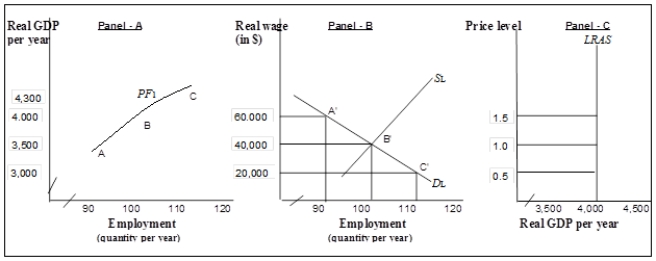 Panel (a) shows an economy's aggregate production function, Panel (b) shows the labor market and Panel (c) shows the economy's long-run aggregate supply curve.
-Refer to Figure 8-5. In the labor market represented in Panel (b) ,
I. the equilibrium real wage equals $40,000.
II. at the equilibrium real wage, 100 million workers are employed.
III. the equilibrium real wage is that which prevails when the economy achieves its natural level of employment.
A) I only
B) I and II only
C) I, II, and III
D) None of the above; to determine if the labor market is in equilibrium, we need information on the economy's aggregate production function.
Correct Answer:
Verified
Q44: Figure 8-5 Q50: Figure 8-5 Q50: Holding everything else unchanged, if a nation's Q53: Consider a firm that produces output using Q55: If output per capita doubles in 30 Q58: Suppose a nation's real GDP grows at Unlock this Answer For Free Now! View this answer and more for free by performing one of the following actions Scan the QR code to install the App and get 2 free unlocks Unlock quizzes for free by uploading documents![]()
![]()

