According to the graph below, which of the following is TRUE? 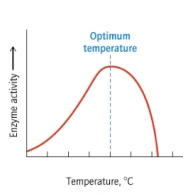
A) At high temperature, the activity of the enzyme decreases more sharply than it does at low temperature.
B) At low temperature, the activity of the enzyme decreases more sharply than it does at high temperature.
C) The maximum activity is at the lowest temperature.
D) The maximum activity is at the highest temperature.
E) The activity of the enzyme is the same at all temperatures.
Correct Answer:
Verified
Q25: What types of biomolecules are enzymes?
A) only
Q90: Acetylcholine is a neurotransmitter that initiates muscle
Q92: Inflammation and pain caused by injury results
Q101: Which of the following statements best describes
Q101: In an enzyme-catalyzed reaction, the reactant that
Q102: Which of the following statements about noncompetitive
Q103: Which statement best describes how an enzyme
Q105: Which of the following statements about enzyme
Q107: Tamoxifen is a drug used to prevent
Q110: Select the statement that best described a
Unlock this Answer For Free Now!
View this answer and more for free by performing one of the following actions

Scan the QR code to install the App and get 2 free unlocks

Unlock quizzes for free by uploading documents