Figure 9-1
The figure illustrates the market for coffee in Guatemala. 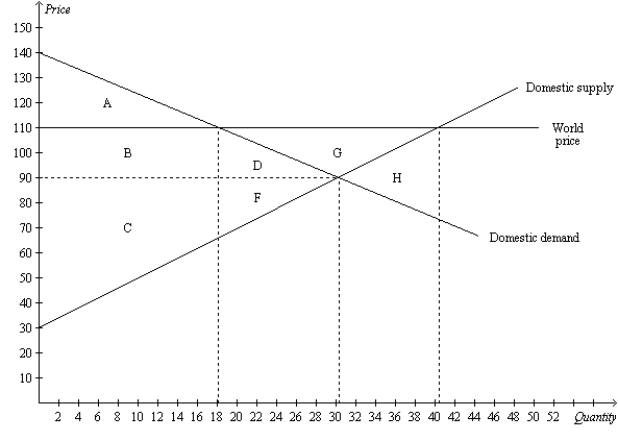
-Refer to Figure 9-1.When trade is allowed,
A) Guatemalan producers of coffee become better off and Guatemalan consumers of coffee become worse off.
B) Guatemalan consumers of coffee become better off and Guatemalan producers of coffee become worse off.
C) both Guatemalan producers and consumers of coffee become better off.
D) both Guatemalan producers and consumers of coffee become worse off.
Correct Answer:
Verified
Q25: Figure 9-1
The figure illustrates the market for
Q26: Which of the following statements is true?
A)Free
Q27: Figure 9-1
The figure illustrates the market for
Q28: Figure 9-1
The figure illustrates the market for
Q29: Figure 9-1
The figure illustrates the market for
Q31: Figure 9-1
The figure illustrates the market for
Q32: Suppose Iceland goes from being an isolated
Q33: Figure 9-1
The figure illustrates the market for
Q34: Within a country,the domestic price of a
Q35: Suppose a country begins to allow international
Unlock this Answer For Free Now!
View this answer and more for free by performing one of the following actions

Scan the QR code to install the App and get 2 free unlocks

Unlock quizzes for free by uploading documents