Table 7-7 
-Refer to Table 7-7. You are selling extra tickets to the Midwest Regional Sweet 16 game in the men's NCAA basketball tournament. The table shows the willingness to pay of the four potential buyers in the market for a ticket to the game. Which of the following graphs represents the market demand curve?
A) 
B) 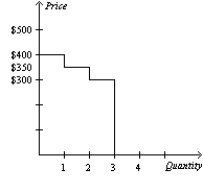
C) 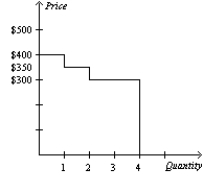
D) 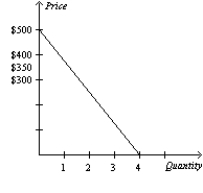
Correct Answer:
Verified
Q23: A drought in California destroys many red
Q383: Table 7-6
For each of three potential buyers
Q384: Table 7-9
The only four consumers in a
Q385: Table 7-8
During the last two days, Chad
Q386: Table 7-7 Q387: Table 7-6![]()
For each of three potential buyers
Unlock this Answer For Free Now!
View this answer and more for free by performing one of the following actions

Scan the QR code to install the App and get 2 free unlocks

Unlock quizzes for free by uploading documents