Figure 6-27
This figure shows the market demand and market supply curves for good Z. 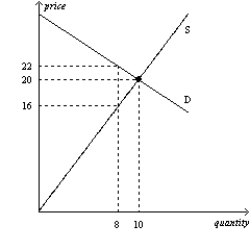
-Refer to Figure 6-27.Suppose a tax of $3 per unit is imposed on this market.What will be the new equilibrium quantity in this market?
A) less than 8 units
B) 8 units
C) between 8 units and 10 units
D) greater than 10 units
Correct Answer:
Verified
Q128: Figure 6-26 Q129: The price paid by buyers in a Q130: Figure 6-26 Q131: Figure 6-28 Q132: Figure 6-26 Q134: Figure 6-27 Q135: Figure 6-25 Q136: The price received by sellers in a Q137: Figure 6-25 Q138: The quantity sold in a market will Unlock this Answer For Free Now! View this answer and more for free by performing one of the following actions Scan the QR code to install the App and get 2 free unlocks Unlock quizzes for free by uploading documents![]()
![]()
![]()
![]()
This figure shows the market demand![]()
![]()

