Multiple Choice
Figure 6-27
This figure shows the market demand and market supply curves for good Z. 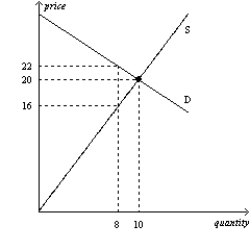
-Refer to Figure 6-27.Suppose a tax of $6 per unit is imposed on this market.How much will buyers pay per unit after the tax is imposed?
A) $16
B) between $16 and $20
C) between $20 and $22
D) $22
Correct Answer:
Verified
Related Questions

