Figure 4-11 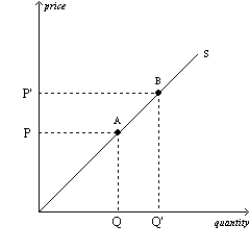
-Refer to Figure 4-11.The movement from point A to point B on the graph is caused by
A) a decrease in the price of the good.
B) an increase in the price of the good.
C) an advance in production technology.
D) a decrease in input prices.
Correct Answer:
Verified
Q29: The supply curve for a good is
Q30: A rightward shift of a supply curve
Q32: A movement upward and to the right
Q33: A supply curve slopes upward because
A)as more
Q35: The difference between a supply schedule and
Q39: Once the supply curve for a product
Q204: A supply schedule is a table that
Q205: When we move along a given supply
Q207: If something happens to alter the quantity
Q213: The line that relates the price of
Unlock this Answer For Free Now!
View this answer and more for free by performing one of the following actions

Scan the QR code to install the App and get 2 free unlocks

Unlock quizzes for free by uploading documents