Figure 4-11 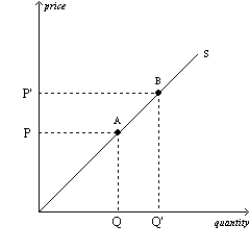
-Refer to Figure 4-11.The movement from point A to point B on the graph represents
A) an increased willingness and ability on the part of suppliers to supply the good at each possible price.
B) an increase in the number of suppliers.
C) a decrease in the price of a relevant input.
D) an increase in the price of the good that is being supplied and the suppliers' responses to that price change.
Correct Answer:
Verified
Q22: A leftward shift of a supply curve
Q23: An increase in supply is represented by
Q24: The following table contains a supply schedule
Q25: Which of the following demonstrates the law
Unlock this Answer For Free Now!
View this answer and more for free by performing one of the following actions

Scan the QR code to install the App and get 2 free unlocks

Unlock quizzes for free by uploading documents