Figure 4-16 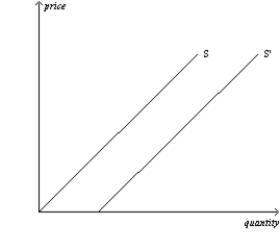
-Refer to Figure 4-16. If the supply curves that are drawn represent supply curves for single-family residential houses, then the movement from S to S' could be caused by a(n)
A) increase in the price of apartments which are a substitute for single-family houses for many people looking for a place to live.
B) newly-formed expectation by house-builders that prices of houses will increase significantly in the next six months.
C) decrease in the price of lumber.
D) All of the above are correct.
Correct Answer:
Verified
Q5: A movement downward and to the right
Q12: An increase in quantity demanded
A)results in a
Q15: A decrease in quantity demanded
A)results in a
Q82: Figure 4-15 Q90: A decrease in the number of sellers Q92: Figure 4-15 Q94: An increase in which of the following Q174: The quantity demanded of a good is Q407: Figure 4-16 Q414: Figure 4-16 Unlock this Answer For Free Now! View this answer and more for free by performing one of the following actions Scan the QR code to install the App and get 2 free unlocks Unlock quizzes for free by uploading documents![]()
![]()
![]()
![]()

