Table 20-2
Percentage of Before-Tax Income Received by Families in Hapland 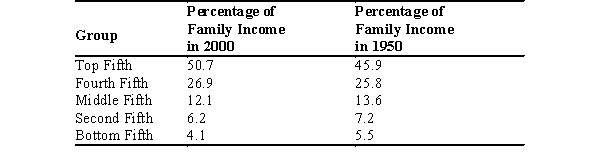
-Refer to Table 20-2. According to the table, from 1950 to 2000, the Hapland income distribution became
A) less equal.
B) more equal.
C) more equal at the lowest level of income but less equal at highest level of income.
D) less equal at the lowest level of income but more equal at highest level of income.
Correct Answer:
Verified
Q219: Based on U.S. income data from 2011,
Q220: The 2011 U.S. distribution of income shows
Q221: Table 20-1
The following table shows the distribution
Q222: Table 20-3
The Distribution of Income in Edgerton
Q223: Table 20-3
The Distribution of Income in Edgerton
Q225: Table 20-1
The following table shows the distribution
Q226: Which of the following explains the rise
Q227: Table 20-1
The following table shows the distribution
Q228: In 2011, what percentage of U.S. families
Q229: Table 20-1
The following table shows the distribution
Unlock this Answer For Free Now!
View this answer and more for free by performing one of the following actions

Scan the QR code to install the App and get 2 free unlocks

Unlock quizzes for free by uploading documents