Table 20-9
Income Inequality in the United States
The values in the table reflect the percentages of pre-tax-and transfer income. 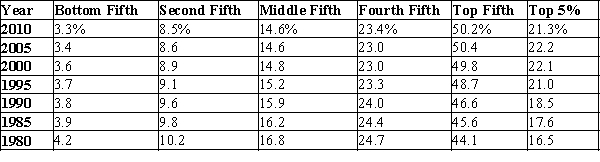 Source: US Census Bureau
-Refer to Table 20-9. Which of the following statements best describes the trends in the table?
A) From 1980 to 2010, the distribution of income has become less equal.
B) From 1980 to 2010, the distribution of income has remained the same.
C) From 1980 to 2010, the distribution of income has become more equal.
D) None of the above is correct.
Correct Answer:
Verified
Q246: Table 20-5
Distribution of Income in Umakastan
Q247: Which of the following statements is correct?
A)The
Q248: Table 20-8 Q249: When comparing the percentage of income (or Q250: Table 20-9 Q252: When we compare the income distribution of Q253: The United States has less income inequality Q254: Table 20-8 Q255: Of the four countries below, which has Q256: Table 20-6 Unlock this Answer For Free Now! View this answer and more for free by performing one of the following actions Scan the QR code to install the App and get 2 free unlocks Unlock quizzes for free by uploading documents![]()
Income Inequality in the United States
The![]()
![]()

