Table 20-9
Income Inequality in the United States
The values in the table reflect the percentages of pre-tax-and transfer income. 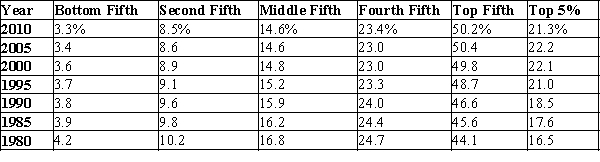 Source: US Census Bureau
-Refer to Table 20-9. In 2010, the top fifth of the US population had
A) 50.2% more income than the remainder of the population.
B) a lower share of income than the top fifth in 1980.
C) about 15 times as much income as the bottom fifth.
D) about 6 times as much income as the middle fifth.
Correct Answer:
Verified
Q245: Of the four countries below, the country
Q246: Table 20-5
Distribution of Income in Umakastan
Q247: Which of the following statements is correct?
A)The
Q248: Table 20-8 Q249: When comparing the percentage of income (or Q251: Table 20-9 Q252: When we compare the income distribution of Q253: The United States has less income inequality Q254: Table 20-8 Q255: Of the four countries below, which has![]()
Income Inequality in the United States
The![]()
Unlock this Answer For Free Now!
View this answer and more for free by performing one of the following actions

Scan the QR code to install the App and get 2 free unlocks

Unlock quizzes for free by uploading documents