Multiple Choice
Figure 20-2 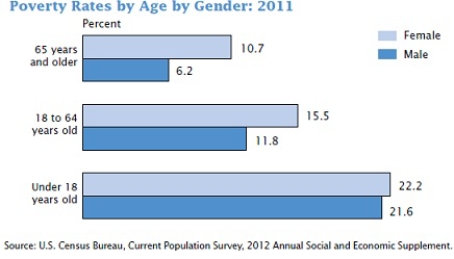
-Refer to Figure 20-2. Which of the following is consistent with the data reported in the figure?
A) The female poverty rate is higher for all age groups than the male poverty rate.
B) The disparity between male and female poverty increases with age.
C) Neither a nor b are correct.
D) Both a and b are correct.
Correct Answer:
Verified
Related Questions
Q293: Figure 20-1 Q294: The distribution of income for Inequalia is
Number of Poor ![]()

