Figure 20-3 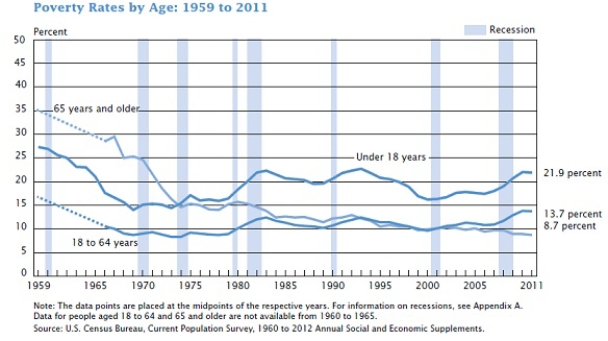
-Refer to Figure 20-3. Which of the following best describes the poverty rates by age from 1965 to 2011?
A) The poverty rates by age have declined for all age groups.
B) The percentage of people living in poverty has consistently been highest for the elderly aged 65 and over and lowest for adults aged 18 to 64.
C) The percentage of children under age 18 and the percentage of adults aged 18 to 64 have maintained a similar trend while the percentage of elderly aged 65 and over has decreased significantly.
D) The poverty rates by age have increased for all age groups.
Correct Answer:
Verified
Q276: Table 20-10 Q277: Since 1959 when the official data on Q278: When John F. Kennedy said, "A rising Q279: Table 20-10 Q280: The poverty rate is a measure of Q282: In 2011, the poverty line for a Q283: Figure 20-3 Q284: Figure 20-3 Q285: The poverty line in the country of Q286: Figure 20-3 Unlock this Answer For Free Now! View this answer and more for free by performing one of the following actions Scan the QR code to install the App and get 2 free unlocks Unlock quizzes for free by uploading documents![]()
![]()
![]()
![]()
![]()

