Figure 18-8
This figure below shows the labor market for automobile workers. The curve labeled S is the labor supply curve, and the curves labeled D1 and D2 are the labor demand curves. On the horizontal axis, L represents the quantity of labor in the market. 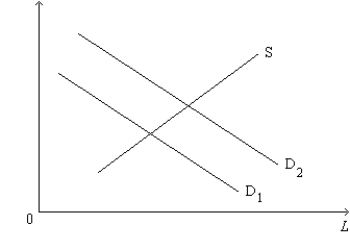
-Refer to Figure 18-8. Which of the following is a possible explanation of the shift of the labor-demand curve from D1 to D2?
A) The wage earned by automobile workers increased.
B) The price of automobiles increased.
C) The opportunity cost of leisure, as perceived by automobile workers, decreased.
D) Large segments of the population changed their tastes regarding leisure versus work.
Correct Answer:
Verified
Q175: Suppose that the market for labor is
Q176: Scenario 18-6
Rocchetta Industries manufactures and supplies bottled
Q177: Consider the market for medical doctors. Suppose
Q180: Suppose that the market for labor is
Q181: Figure 18-10 Q182: Figure 18-9 Q183: Suppose that technological progress increases the productivity Unlock this Answer For Free Now! View this answer and more for free by performing one of the following actions Scan the QR code to install the App and get 2 free unlocks Unlock quizzes for free by uploading documents![]()
![]()

