Figure 15-22
The diagram depicts the market situation for a monopoly pastry shop called Bearclaws. 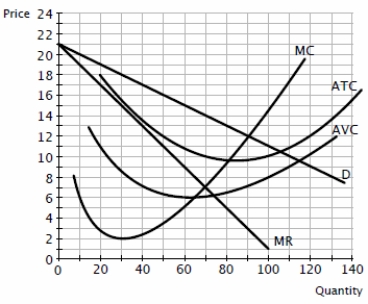
-Refer to Figure 15-22. If we want to plot the supply curve for Bearclaws, what is the lowest output that it would produce?
A) 56 units.
B) 35 units.
C) 40 units.
D) None of these, since a monopoly does not have a supply curve.
Correct Answer:
Verified
Q161: Scenario 15-1
A monopoly firm maximizes its profit
Q483: Figure 15-22
The diagram depicts the market situation
Q484: Figure 15-22
The diagram depicts the market situation
Q485: Figure 15-22
The diagram depicts the market situation
Q486: What happens to the price and quantity
Q487: Name brand drugs are able to continue
Q489: Generic drugs enter the pharmaceutical drug market
Q490: Figure 15-22
The diagram depicts the market situation
Q491: Due to the nature of the patent
Q492: After the patent runs out on a
Unlock this Answer For Free Now!
View this answer and more for free by performing one of the following actions

Scan the QR code to install the App and get 2 free unlocks

Unlock quizzes for free by uploading documents