The relative frequency histogram for the age (in years) of a sample of 25 employees from a
government department, is given below. 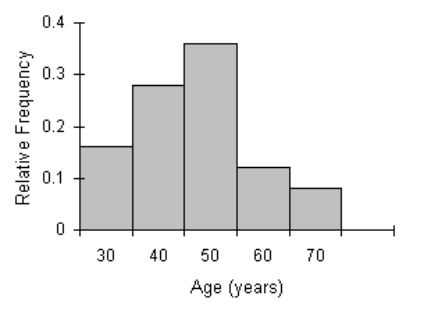 Explain what the best measure of central location is.
Correct Answer:
Verified
View Answer
Unlock this answer now
Get Access to more Verified Answers free of charge
Q100: The following data represent the weights
Q101: The following data represent the ages
Q102: The following data represent the ages
Q103: The following data provide the hours
Q104: The following data represent the ages
Q106: The following data represent the ages
Q107: The following data represent the ages
Q108: The following data represent the ages
Q109: The following data represent the ages
Q110: The following data represent the ages
Unlock this Answer For Free Now!
View this answer and more for free by performing one of the following actions

Scan the QR code to install the App and get 2 free unlocks

Unlock quizzes for free by uploading documents