The frequency histogram for the heights (in cm) of the 25 students in a business statistics class is given below. 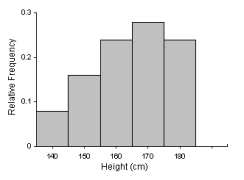 What is the best measure of variability?
Correct Answer:
Verified
View Answer
Unlock this answer now
Get Access to more Verified Answers free of charge
Q140: The following data represent the salaries
Q141: A linear regression model estimating the relationship
Q141: A linear regression model estimating the relationship
Q141: The following data are the heights
Q142: The following data are the heights
Q143: A linear regression model estimating the relationship
Q146: The frequency histogram for the heights (in
Q146: A linear regression model estimating the relationship
Q147: A media article claimed that there was
Q148: What is wrong with this statement:
"When the
Unlock this Answer For Free Now!
View this answer and more for free by performing one of the following actions

Scan the QR code to install the App and get 2 free unlocks

Unlock quizzes for free by uploading documents