The bar chart below is of the colour of motor vehicles in a random sample. A student commented that the distribution was negatively skewed. Explain what is wrong with this statement.
Motor Vehicle Colour Relative Frequency Bar Chart 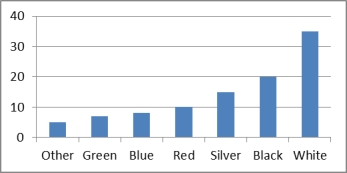
Correct Answer:
Verified
View Answer
Unlock this answer now
Get Access to more Verified Answers free of charge
Q45: Graphical deception is acceptable when the graph
Q48: For each of the following numerical variables,
Q54: Construct a relative frequency histogram for
Q55: For a bar chart to show graphical
Q55: Consider the following cumulative frequency distribution.
Q57: Construct an ogive for the test
Q58: Construct a frequency distribution and relative
Q62: The number of houses sold in
Q63: The following table shows the annual
Q64: The number of faulty items returned
Unlock this Answer For Free Now!
View this answer and more for free by performing one of the following actions

Scan the QR code to install the App and get 2 free unlocks

Unlock quizzes for free by uploading documents