Which of the lines on the figure below is the best representation of the relationship between the volume and the number of moles of a gas, measured at constant temperature and pressure? 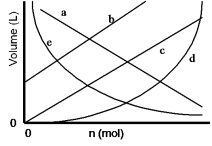
A) a
B) b
C) c
D) d
E) e
Correct Answer:
Verified
Q22: A sample of the inert gas krypton
Q30: A carbon dioxide sample weighing 44.0
Q31: A 0.850-mole sample of nitrous oxide,
Q33: Calculate the temperature of an argon
Q33: A sample of nitrogen gas at 298
Q36: A weather balloon was initially at a
Q36: Nitrogen dioxide is a red-brown gas
Q38: A sample of carbon dioxide gas
Q43: A sample of propane, a component of
Q49: A 500-mL sample of argon at 800
Unlock this Answer For Free Now!
View this answer and more for free by performing one of the following actions

Scan the QR code to install the App and get 2 free unlocks

Unlock quizzes for free by uploading documents