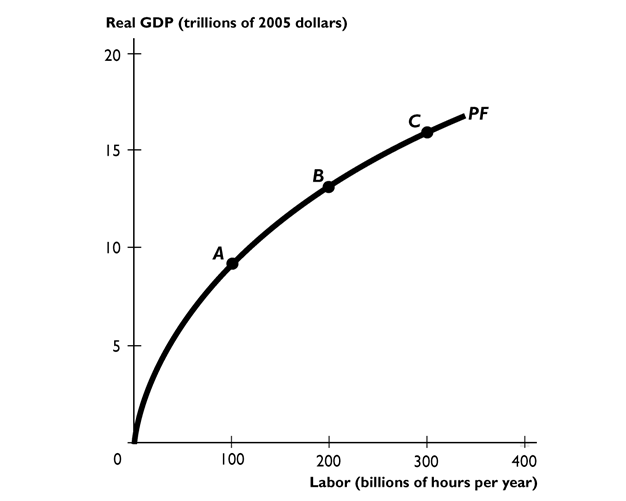
The figure above shows the U.S. production function.
-How would an increase in income taxes be shown in the figure?
A) an upward shift or rotation of the production function
B) a movement from point C to point B
C) a downward shift or rotation of the production function
D) a movement from point A to point B
E) None of the above because the effects of an increase in taxes cannot be shown in the figure.
Correct Answer:
Verified
Q94: A country's potential GDP is determined, in
Q95: A firm hires labor up to the
Q96: Which of the following would have the
Q97: The gap in GDP between the United
Q98: Households increase the quantity of labor supplied
Q100: If the government increases unemployment benefits, then
Q101: The labor market is in equilibrium whenever
A)the
Unlock this Answer For Free Now!
View this answer and more for free by performing one of the following actions

Scan the QR code to install the App and get 2 free unlocks

Unlock quizzes for free by uploading documents