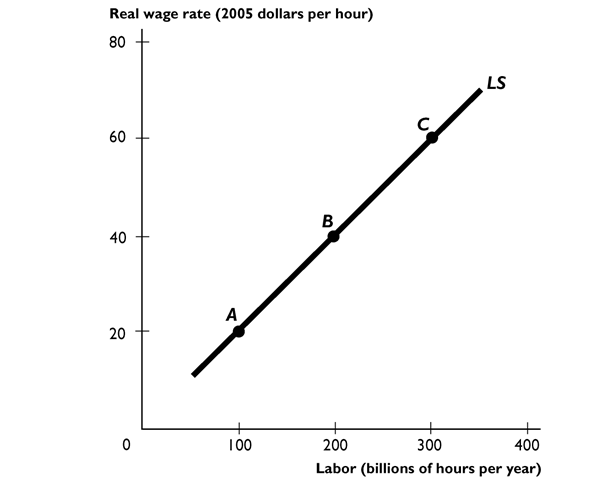
The figure above shows the U.S. supply of labor curve.
- What was the affect of the decline in birth rates during the 1960s and 1970s on the supply of labor curve in the 1980s ?
A) a movement downward along the supply of labor curve from a point such as A to a point such as B
B) a leftward shift of the supply of labor curve
C) a rightward shift of the supply of labor curve
D) The supply of labor curve became steeper.
E) None of the above answers is correct because there was no change in the supply of labor curve.
Correct Answer:
Verified
Q113: Q114: When all other influences on work plans Q115: The Lucas Wedge shows Q116: The level of real GDP the economy Q117: More generous unemployment benefits------------- the opportunity cost Q119: The demand for labor curve is Q120: The idea that potential GDP is the Q121: If the real wage rate decreases from Q122: A surplus of labor is eliminated by Q123: Which of the following can result in![]()
A)whether a country needs
A)a horizontal
Unlock this Answer For Free Now!
View this answer and more for free by performing one of the following actions

Scan the QR code to install the App and get 2 free unlocks

Unlock quizzes for free by uploading documents