Multiple Choice
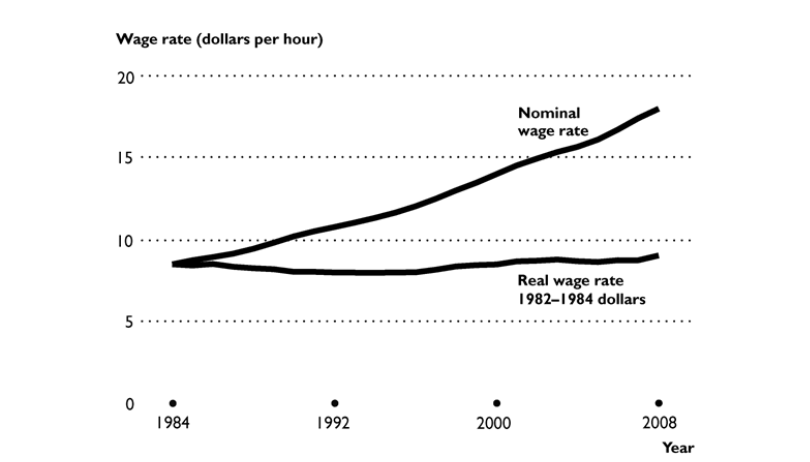
The trends displayed in the table can best be explained by
A) the nominal wage rate has increased at a rate about equal to the inflation rate.
B) the inflation rate has been rising over the time period.
C) service industries have increased as a proportion of the economy and they tend to have higher nominal wage rates.
D) the real wage rate has increased at a rate about equal to the inflation rate.
E) None of the above can explain the trends in the figure.
Correct Answer:
Verified
Related Questions

