-
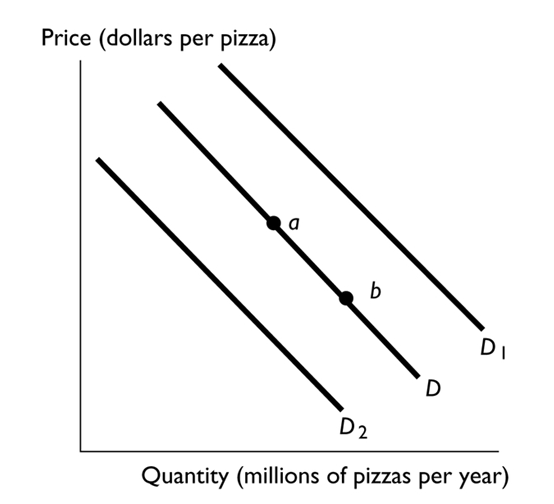
In the above figure, the shift in the demand curve from D to D1 can be the result of
A) an increase in the number of teenagers, all of whom demand more pizza than do other age groups.
B) an increase in the price of soda, a complement to pizza.
C) new technology that increases the profit from producing pizza.
D) a decrease in income if pizza is a normal good.
E) a decrease in the price of a sub sandwich, a substitute for pizza.
Correct Answer:
Verified
Q23: During 2008 the supply of gasoline decreased
Q24: When there is a surplus of snowboards,
Q25: The law of demand refers to how
A)demand
Q26: Q27: If the demand curve for desktop computers Q29: The law of supply reflects the fact Q30: If the supply of iPods increases, then![]()
i.the
Unlock this Answer For Free Now!
View this answer and more for free by performing one of the following actions

Scan the QR code to install the App and get 2 free unlocks

Unlock quizzes for free by uploading documents