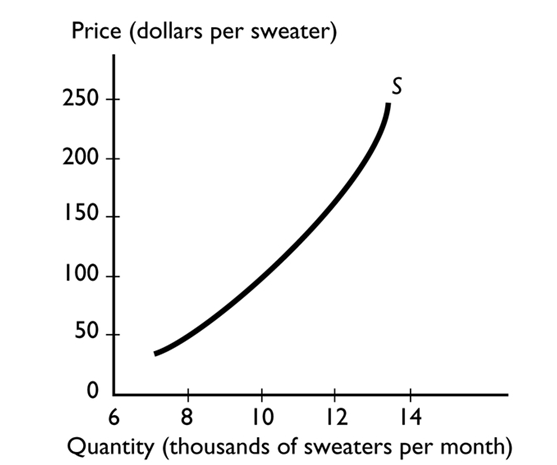
The graph illustrates the supply of sweaters. As the technology used to produce sweaters improves, the
A) supply of sweaters decreases and the demand for sweaters does not change.
B) supply of sweaters increases and the demand for sweaters increases.
C) supply of sweaters increases and the demand for sweaters does not change.
D) quantity of sweaters supplied increases.
E) quantity of sweaters supplied decreases.
Correct Answer:
Verified
Q44: Q54: To find the market demand curve for Q55: Q56: If the number of companies producing memory Q58: Suppose the equilibrium price of movie tickets Q59: Consumers regard Dell computers and Apple computers Q60: A demand schedule Q61: Suppose that the equilibrium price and quantity Q62: The quantity supplied of a good is Q225: Unlock this Answer For Free Now! View this answer and more for free by performing one of the following actions Scan the QR code to install the App and get 2 free unlocks Unlock quizzes for free by uploading documents![]()
![]()
A)shows how the demand changes
A)equal![]()

