-
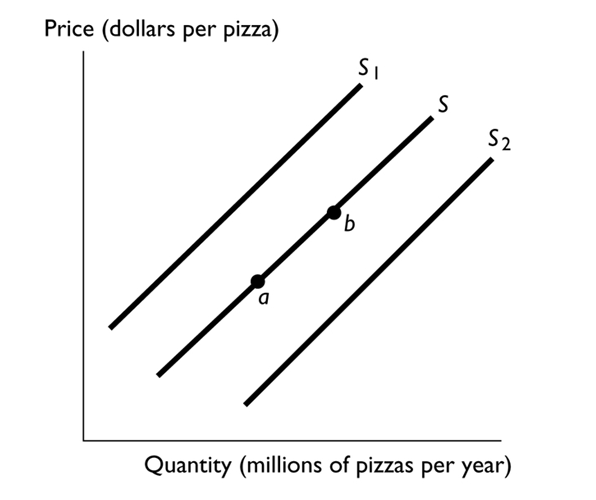
In the above figure, the shift in the supply curve from S to S2 reflects
A) a decrease in the supply of pizza.
B) an increase in the supply of pizza.
C) an increase in the quantity of pizza supplied.
D) a decrease in the quantity of pizza supplied.
E) a decrease in the supply of pizza and a simultaneous decrease in the quantity of pizza supplied.
Correct Answer:
Verified
Q42: Gasoline prices increase by 50 percent and
Q44: Ramen noodles are a staple food item
Q45: Q46: Which of the following is true? Q48: Which of the following is correct? Q49: Other things remaining the same, the quantity Q50: Suppose the equilibrium price of oranges is Q51: The market supply curve is thethe -------------of Q148: In the figure above,if point "a" represents Q225: ![]()
A)If people
I. A![]()
Unlock this Answer For Free Now!
View this answer and more for free by performing one of the following actions

Scan the QR code to install the App and get 2 free unlocks

Unlock quizzes for free by uploading documents