-
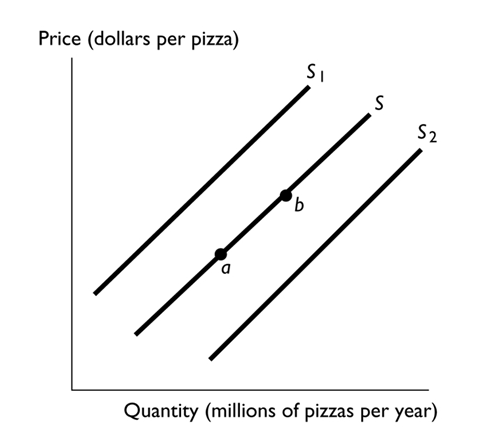
In the above figure, the shift in the supply curve from S to S2 might reflect
A) a decrease in the number of pizza producers.
B) an increase in the price of a pizza.
C) a decrease in the cost of the tomato sauce used to produce pizza.
D) an increase in income if pizza is a normal good.
E) an increase in the price of a good that is a substitute for consumers.
Correct Answer:
Verified
Q85: Which of the following increases the supply
Q86: An increase in the number of pineapple
Q87: If the number of sellers decreases, then
Q88: Which of the following statements is true
Q89: To be part of the supply for
Q91: The number of buyers of sport utility
Q92: When demand increases,
A)consumers buy more of the
Q93: In Great Britain, raising taxes on gasoline
Q94: Car insurance and cars are complements. If
Q233: ![]()
Unlock this Answer For Free Now!
View this answer and more for free by performing one of the following actions

Scan the QR code to install the App and get 2 free unlocks

Unlock quizzes for free by uploading documents