-
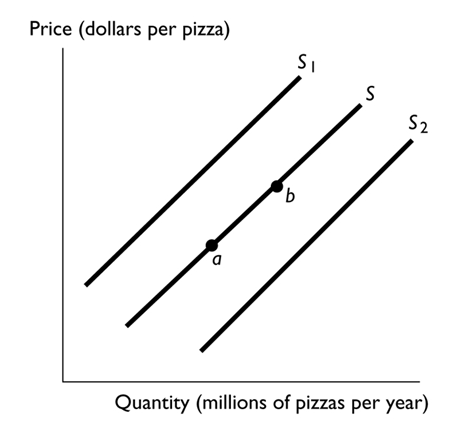
In the above figure, the shift in the supply curve from S to S1 reflects
A) an increase in the quantity of pizza supplied.
B) a decrease in the supply of pizza.
C) an increase in the supply of pizza.
D) a decrease in the quantity of pizza supplied.
E) None of the above answers is correct.
Correct Answer:
Verified
Q117: Market equilibrium occurs when
A)the quantity demanded equals
Q118: Which of the following results in a
Q119: A change in the price of a
Q120: Which of the following shifts the supply
Q121: Q123: A competitive market is in equilibrium. Then Q124: Market equilibrium Q125: Soda and hot dogs are complements for Q126: A rise in the price of a Q127: ![]()
i. can never occur because there![]()
Unlock this Answer For Free Now!
View this answer and more for free by performing one of the following actions

Scan the QR code to install the App and get 2 free unlocks

Unlock quizzes for free by uploading documents