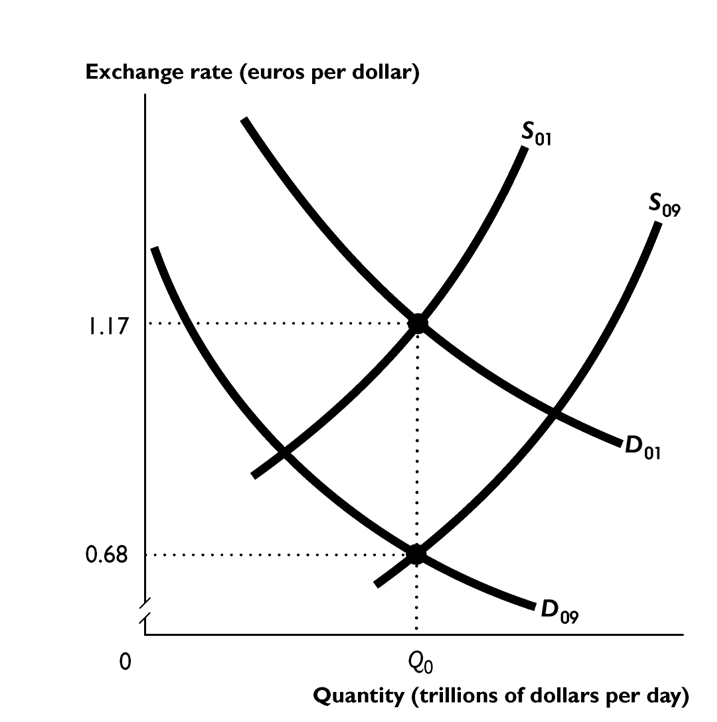
The figure above shows the market for foreign exchange in 2001 and 2009.
-
Which of the following could have lead to the shifts illustrated in the figure above?
I. The U.S. exchange rate was expected to depreciate between 2001 and 2009.
Ii. The U.S. exchange rate was expected to appreciate between 2001 and 2009.
Iii. The U.S. interest rate rose relative to interest rates in other countries between 2001 and 2009.
A) i and iii
B) i only
C) ii only
D) ii and iii
E) iii only
Correct Answer:
Verified
Q39: If the exchange rate rises, then the
Q40: In the foreign exchange market, when the
Q41: In 2008, the current account balance was
Q42: The balance of payments accounts record all
Q43: If the exchange rate changes from 1.10
Q45: In the long run, the exchange rate
Q46: A nation that is a net borrower
Unlock this Answer For Free Now!
View this answer and more for free by performing one of the following actions

Scan the QR code to install the App and get 2 free unlocks

Unlock quizzes for free by uploading documents