-
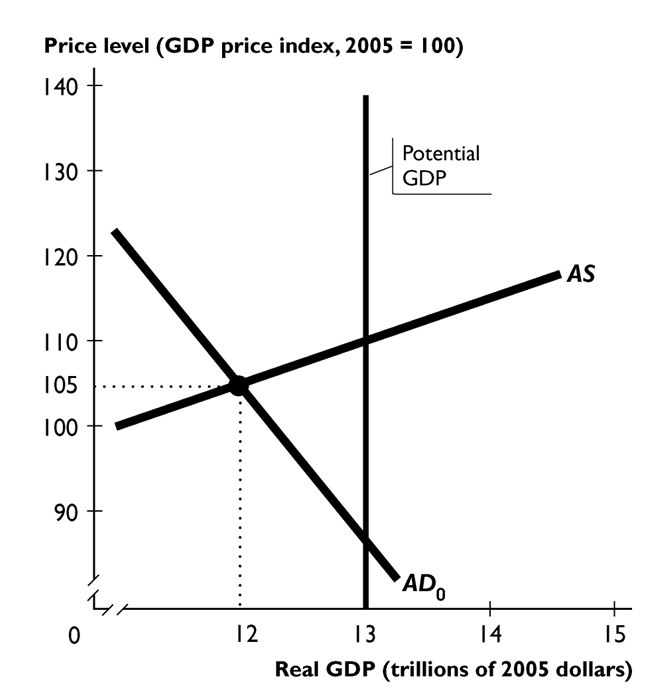
The figure above shows a nation's aggregate demand curve, aggregate supply curve, and potential GDP.
In the figure above, the--------------------gap is equal to--------------------
A) recessionary; $1 trillion
B) recessionary; $13 trillion
C) inflationary; $1 trillion
D) recessionary; $12 trillion
E) inflationary; $12 trillion
Correct Answer:
Verified
Q40: The cyclical deficit is the portion of
Q41: A cut in the income tax rate
Q42: In order to reduce inflationary pressure on
Q43: A tax cut that increases the budget
Q44: The last U.S. president to be in
Q46: Ignoring any supply-side effects, when taxes are
Q47: Which of the following is a limitation
Q48: Which of the following is an example
Q49: The balanced budget multiplier is
A)positive because the
Q50: Discretionary fiscal policy is defined as fiscal
Unlock this Answer For Free Now!
View this answer and more for free by performing one of the following actions

Scan the QR code to install the App and get 2 free unlocks

Unlock quizzes for free by uploading documents