Multiple Choice
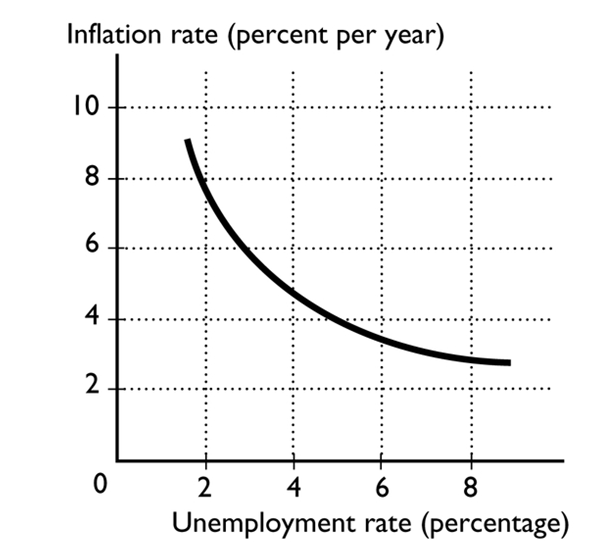
The curve shown in the figure above is the
A) potential GDP curve.
B) aggregate demand curve.
C) aggregate supply curve.
D) Phillips curve.
E) demand for money curve.
Correct Answer:
Verified
Related Questions
The curve shown in the figure above is the
A) potential GDP curve.
B) aggregate demand curve.
C) aggregate supply curve.
D) Phillips curve.
E) demand for money curve.
Correct Answer:
Verified

