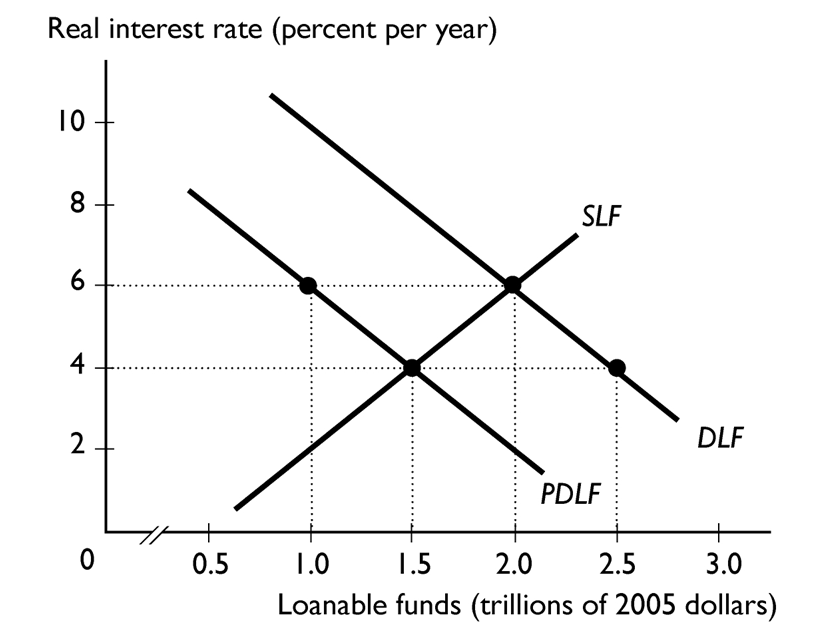
In the figure above, the DLF curve is the demand for loanable funds curve and the PDLF curve is the private demand for loanable funds curve.
- If there is no Ricardo-Barro effect, the figure shows the situation in which the government has a --------------------so that the equilibrium real interest rate is--------------------
and the equilibrium quantity of investment is-------------------- .
A) budget deficit; 4 percent; $1 trillion
B) budget deficit; 6 percent; $1.5 trillion
C) balanced budget; 6 percent; $1.5 trillion
D) budget surplus; 6 percent; $1.5 trillion
E) budget surplus; 4 percent; $1 trillion
Correct Answer:
Verified
Q118: When the real interest rate --------------------the equilibrium
Q119: An increase in the expected profit from
Q120: The real interest rate is--------------------related to the
Q121: The supply of loanable funds schedule shows
Q122: Which of the following are typically financed
Q124: What happens to the demand for loanable
Q125: If there is no Ricardo-Barro effect, a
Q126: If saving supply decreases, the equilibrium real
Q127: If the real interest rate falls, there
Q128: Which of the following decreases the demand
Unlock this Answer For Free Now!
View this answer and more for free by performing one of the following actions

Scan the QR code to install the App and get 2 free unlocks

Unlock quizzes for free by uploading documents