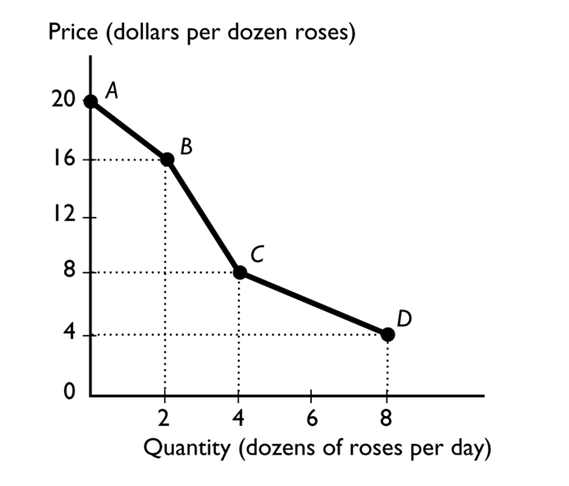
The figure above shows the relationship between the price of a dozen roses and the quantity of roses a florist can sell. The slope between points A and B is
A) 2.
B) 20.
C) 16.
D) 4
E) nonexistent because at point A, no roses are sold.
Correct Answer:
Verified
Q6: Macroeconomics is the study of
A)national or global
Q8: A scatter diagram can be used to
Q9: Of the three major economic questions, which
Q10: The value of the best thing that
Q12: Q13: Q14: Which type of economic graph reveals trends Q15: Suppose you take a trip during Spring Q16: When two variables in a graph are Q200: Unlock this Answer For Free Now! View this answer and more for free by performing one of the following actions Scan the QR code to install the App and get 2 free unlocks Unlock quizzes for free by uploading documents![]()
![]()
![]()

