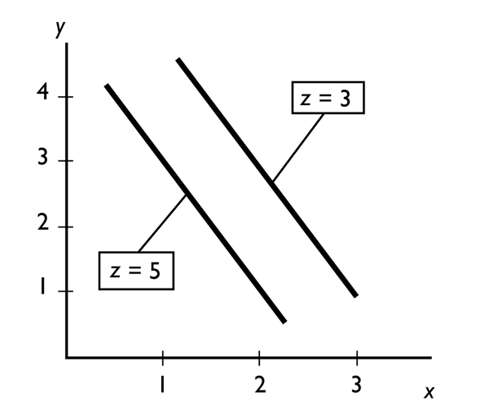
In the figure above, an increase in z leads to a
A) leftward shift of the line showing the relationship between x and y.
B) rightward shift of the line showing the relationship between x and y.
C) movement down along one of the lines showing the relationship between x and y.
D) movement up along one of the lines showing the relationship between x and y.
E) trend change in both x and y.
Correct Answer:
Verified
Q65: The additional benefit of increasing some activity
Q66: Proponents of cuts in income tax rates
Q67: The opportunity cost of a one-unit increase
Q68: A time series graph reveals whether there
Unlock this Answer For Free Now!
View this answer and more for free by performing one of the following actions

Scan the QR code to install the App and get 2 free unlocks

Unlock quizzes for free by uploading documents