Multiple Choice
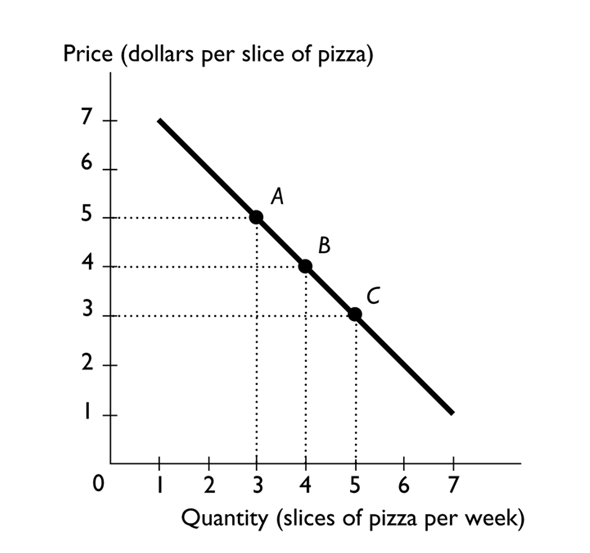
The above figure shows the relationship between the price of a slice of pizza and how many slices of pizza Ricardo buys in a week. Between points A and B, the slope of the line equals
A) -4.
B) -3.
C) -2
D) -5.
E) -1.
Correct Answer:
Verified
Related Questions
Q60: In a graph, a straight line has
Q61: An incentive is
A)what you must give up
Q63: John has two hours of free time
Q65: The additional benefit of increasing some activity
Q66: Proponents of cuts in income tax rates
Q67: The opportunity cost of a one-unit increase
Q68: A time series graph reveals whether there

