Multiple Choice
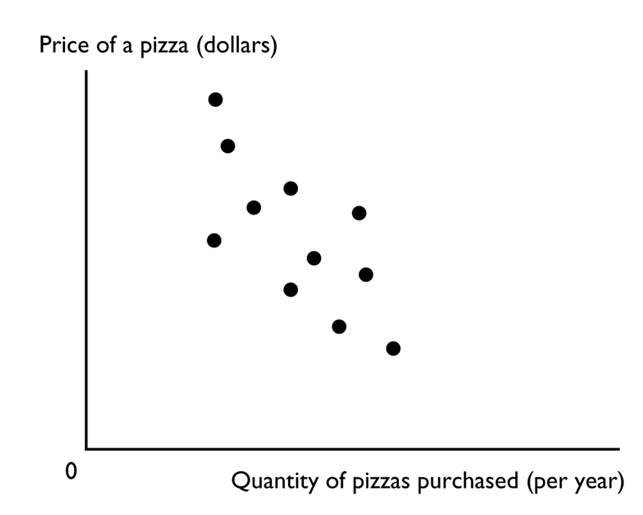
The figure above shows a
A) cross-section graph.
B) scatter diagram.
C) time-series graph.
D) trend diagram
E) slope.
Correct Answer:
Verified
Related Questions
The figure above shows a
A) cross-section graph.
B) scatter diagram.
C) time-series graph.
D) trend diagram
E) slope.
Correct Answer:
Verified

