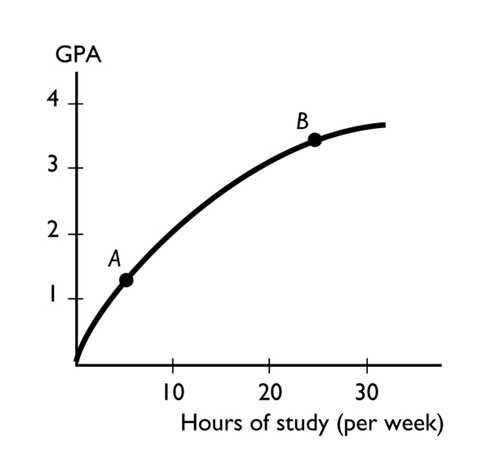
The figure above shows the relationship between the time a student spends studying and the student's GPA that semester. The slope of the relationship at point A -------------------- the slope at point B.
A) is less than
B) is equal to
C) is greater than
D) cannot be compared to
E) can be compared but more information is needed to determine whether the slope is greater than, less than, or equal to
Correct Answer:
Verified
Q168: A slope is measured as the
A)value of
Q169: Q170: As a shoe factory adds more workers, Q171: The --------------------of something is the gain or Q172: If the marginal benefit of the next Q174: Self interest Q175: The cost of a one-unit increase in Q176: In order to determine whether to major Q177: A time-series graph displays the price of Q178: Trend refers to![]()
A)has nothing to do with determining
A)a general tendency for a
Unlock this Answer For Free Now!
View this answer and more for free by performing one of the following actions

Scan the QR code to install the App and get 2 free unlocks

Unlock quizzes for free by uploading documents