Figure 8-6
The following diagram is a cost-volume-profit graph for a manufacturing company: 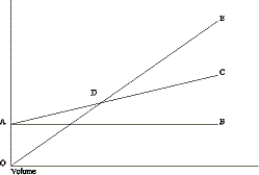
-Refer to Figure 8-6. The difference between line AB and line AC (area BAC) is the
A) contribution ratio.
B) total variable cost.
C) contribution margin per unit.
D) total fixed cost.
Correct Answer:
Verified
Q24: Assuming all other things are equal, fixed
Q25: Using cost-volume-profit analysis, we can conclude that
Q26: Cost-volume-profit models assume that
A)the sales mix may
Q27: In a cost-volume-profit graph, the slope of
Q28: Which of the following assumptions does NOT
Q30: When a company sells more units than
Q31: Figure 8-7
The income statement for Thomas
Q32: Figure 8-7
The income statement for Thomas
Q33: Assuming all other things are the same,
Q34: In a profit-volume graph, the slope of
Unlock this Answer For Free Now!
View this answer and more for free by performing one of the following actions

Scan the QR code to install the App and get 2 free unlocks

Unlock quizzes for free by uploading documents