Figure 26-2.The figure depicts a supply-of-loanable-funds curve and two demand-for-loanable-funds curves.
r 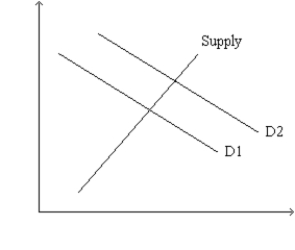 Q
Q
-Refer to Figure 26-2.Which of the following events would shift the demand curve from D1 to D2?
A) The government goes from running a budget deficit to running a budget surplus.
B) Firms become optimistic about the future and,as a result,they plan to increase their purchases of new equipment and construction of new factories.
C) A change in the tax laws encourages people to consume less and save more.
D) A change in the tax laws encourages people to consume more and save less.
Correct Answer:
Verified
Q105: Figure 26-3.The figure shows two demand-for-loanable-funds curves
Q106: Figure 26-3.The figure shows two demand-for-loanable-funds curves
Q107: Figure 26-1.The figure depicts a demand-for-loanable-funds curve
Q108: Figure 26-3.The figure shows two demand-for-loanable-funds curves
Q109: Figure 26-4.On the horizontal axis of the
Q111: Figure 26-4.On the horizontal axis of the
Q112: Figure 26-4.On the horizontal axis of the
Q113: Figure 26-4.On the horizontal axis of the
Q114: Which of the following are effects of
Q115: Figure 26-4.On the horizontal axis of the
Unlock this Answer For Free Now!
View this answer and more for free by performing one of the following actions

Scan the QR code to install the App and get 2 free unlocks

Unlock quizzes for free by uploading documents