Figure 26-3.The figure shows two demand-for-loanable-funds curves and two supply-of-loanable-funds curves. 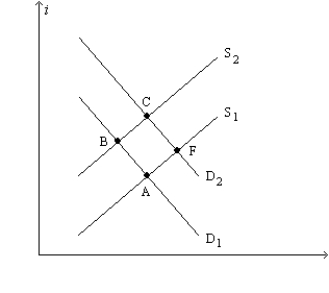
-Refer to Figure 26-3.A shift of the demand curve from D1 to D2 is called
A) an increase in the demand for loanable funds,and that increase would originate from people who had some extra income they wanted to lend.
B) an increase in the demand for loanable funds,and that increase would originate from households and firms who wish to borrow to make investments.
C) a decrease in the demand for loanable funds,and that decrease would originate from people who had some extra income they wanted to lend.
D) a decrease in the demand for loanable funds,and that decrease would originate from households and firms who wish to borrow to make investments.
Correct Answer:
Verified
Q113: Figure 26-4.On the horizontal axis of the
Q114: Which of the following are effects of
Q115: Figure 26-4.On the horizontal axis of the
Q117: Figure 26-1.The figure depicts a demand-for-loanable-funds curve
Q119: Figure 26-4.On the horizontal axis of the
Q120: For an imaginary economy,when the real interest
Q121: For an imaginary economy,when the real interest
Q122: If the quantity of loanable funds demanded
Q123: A government reduces its budget deficit,but at
Q225: Figure 26-3
The figure shows two demand-for-loanable-funds curves
Unlock this Answer For Free Now!
View this answer and more for free by performing one of the following actions

Scan the QR code to install the App and get 2 free unlocks

Unlock quizzes for free by uploading documents