Figure 26-4. On the horizontal axis of the graph, L represents the quantity of loanable funds in billions of dollars. 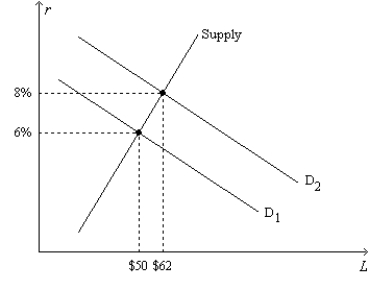
-Refer to Figure 26-4. Which of the following events could explain a shift of the demand-for-loanable-funds curve from  to
to 
?
A) The tax code is reformed to encourage greater saving.
B) The tax code is reformed to encourage greater investment.
C) The government starts running a budget deficit.
D) The government starts running a budget surplus.
Correct Answer:
Verified
Q78: Crowding out occurs when investment declines because
A)a
Q83: A change in the tax laws that
Q94: If the government instituted an investment tax
Q96: Which of the following events could explain
Q97: In the market for loanable funds,the interaction
Q102: Figure 26-2.The figure depicts a supply-of-loanable-funds curve
Q105: Figure 26-3.The figure shows two demand-for-loanable-funds curves
Q106: Figure 26-3.The figure shows two demand-for-loanable-funds curves
Q108: Figure 26-3.The figure shows two demand-for-loanable-funds curves
Q110: Figure 26-2.The figure depicts a supply-of-loanable-funds curve
Unlock this Answer For Free Now!
View this answer and more for free by performing one of the following actions

Scan the QR code to install the App and get 2 free unlocks

Unlock quizzes for free by uploading documents