Figure 10-12 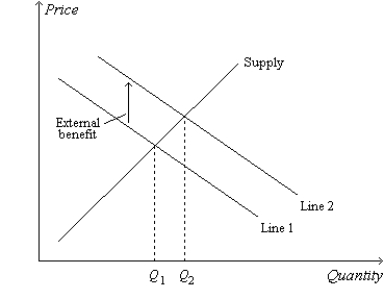
-Refer to Figure 10-12. Suppose, on the figure, Q represents the quantity of education and P represents the price of education. Then the quantity  represents
A) an inefficiency.
B) the extent of the negative externality that pertains to the market for education.
C) the amount of the tax that would be required to correct the negative externality that pertains to the market for education.
D) the amount of the subsidy that would be required to correct the positive externality that pertains to the market for education.
Correct Answer:
Verified
Q401: Table 10-4 Q403: Figure 10-11 Q407: Figure 10-11 Q419: Table 10-4 Q421: Before the flu season begins, Jeremy gets Q425: The externality associated with technology spillovers Q433: Scenario 10-1 Unlock this Answer For Free Now! View this answer and more for free by performing one of the following actions Scan the QR code to install the App and get 2 free unlocks Unlock quizzes for free by uploading documents![]()
![]()
![]()
![]()
A)cannot be
The demand curve for gasoline slopes

