Exhibit 30-1
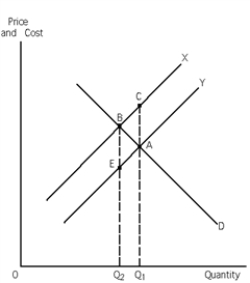
-Refer to Exhibit 30-1. This graph represents a negative externality situation. Given this, which of the two curves, X or Y, represents marginal social costs and why?
A) Curve X, because if there is a negative externality, external costs are associated with it: social costs = external costs + private costs, therefore the marginal social cost curve must lie above the marginal private cost curve.
B) Curve Y, because if there is a negative externality, negative external costs are associated with it: social costs = negative external costs + private costs, therefore the marginal social cost curve must lie below the marginal private cost curve.
C) Curve X, because if there is a negative externality, external benefits are associated with it: social costs = external benefits + private costs, therefore the marginal social cost curve must lie above the marginal private cost curve.
D) Curve Y, because if there is a negative externality, negative external benefits are associated with it: social costs = negative external benefits + private costs, therefore the marginal social cost curve must lie below the marginal private cost curve.
Correct Answer:
Verified
Q19: Positive externalities can be internalized using persuasion,
Q20: Ronald Coase stressed the necessity of using
Q21: Exhibit 30-1 Q22: Exhibit 30-1 Q23: In which of the following situations would Q25: Negative externalities arising from the production of Q26: A side effect of an action that Unlock this Answer For Free Now! View this answer and more for free by performing one of the following actions Scan the QR code to install the App and get 2 free unlocks Unlock quizzes for free by uploading documents
![]()
![]()

