Multiple Choice
Exhibit 19-5
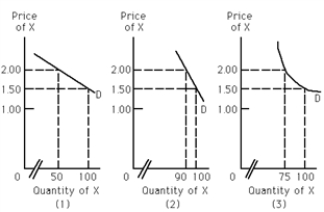
-Refer to Exhibit 19-5. Which of the graphs represents a greater percentage change in quantity demanded than the percentage change in price?
A) (1)
B) (2)
C) (3)
D) (2) and (3)
Correct Answer:
Verified
Related Questions

