The change in equilibrium shown in the accompanying figure would be explained by (an) _____in the price of an input and (an) ______ in the price of a ______. 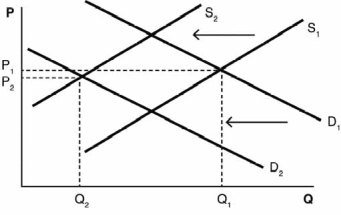
A) increase; increase; complement
B) decrease; increase; complement
C) decrease; increase; substitute
D) increase; decrease; complement
E) increase; increase; substitute
Correct Answer:
Verified
Q122: When both curves shift
A) equilibrium price is
Q124: If the price and quantity for an
Q128: According to a supply and demand model
Q131: When people move to an area of
Q135: In one year,15 bowling alleys opened in
Q136: What would happen to the equilibrium price
Q146: When supply shifts left and demand shifts
Q151: What would happen in the market for
Q154: Top Ramen is a brand of noodles
Q155: When supply shifts right and demand shifts
Unlock this Answer For Free Now!
View this answer and more for free by performing one of the following actions

Scan the QR code to install the App and get 2 free unlocks

Unlock quizzes for free by uploading documents