Use the following information to answer the next questions.
The following graph depicts a market where a tax has been imposed. Pe was the equilibrium price before the tax was imposed, and Qe was the equilibrium quantity. After the tax, PC is the price that consumers pay, and PS is the price that producers receive. QT units are sold after the tax is imposed. NOTE: The areas B and C are rectangles that are divided by the supply curve ST. Include both sections of those rectangles when choosing your answers.
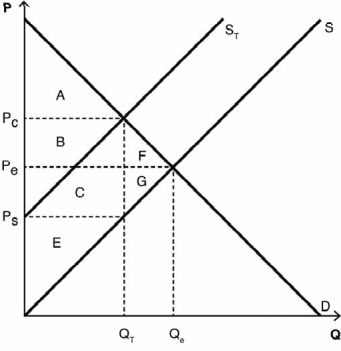
-Which areas represent consumer surplus before the tax is imposed?
A) A + B + F
B) A
C) C + G + E
D) B + C
E) F + G
Correct Answer:
Verified
Q42: "When a good is divided up,it is
Q44: Which of the following statements is concerned
Q45: Use the following information to answer the
Q51: Which of the following statements is concerned
Q53: "When a good is divided up,it is
Q55: Use the following information to answer the
Q59: A tax on apples would cause consumers
Q61: It is said that taxes drive a
Q75: In most cases,taxes reduce economic efficiency because
A)
Q80: The difference between the price consumers pay
Unlock this Answer For Free Now!
View this answer and more for free by performing one of the following actions

Scan the QR code to install the App and get 2 free unlocks

Unlock quizzes for free by uploading documents