Refer to the following graph to answer the following questions: 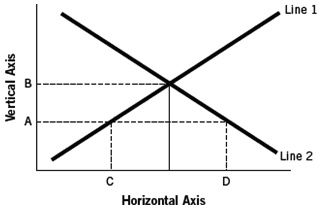
-Assuming the figure represents the market for loanable funds,it would be true that
A) line 1 represents savings (supply) ,and line 2 represents investment (demand) .
B) the vertical axis represents the interest rate,and the distance between points C and D represents the surplus of loanable funds at interest rate A.
C) line 1 represents investment demand,and line 2 represents savings.
D) the vertical axis represents the quantity of funds lent and borrowed,whereas the distance between points C and D represents the shortage of loanable funds at interest rate A.
E) line 1 represents the interest rate,and line 2 represents the quantity of savings.
Correct Answer:
Verified
Q24: Gross domestic product requires
A) inflation equal to
Q25: Two nations are located next to one
Q26: The government engages in more deficit spending.Ceteris
Q27: You are an entrepreneur about to start
Q28: Refer to the following graph to answer
Q30: Since firms are the primary
A) demanders of
Q31: A bond is an instrument that allows
Q32: Refer to the following graph to answer
Q33: Arguably,interest represents
A) both a cost to lenders
Q34: Smiley Myrus owns a large corporation that
Unlock this Answer For Free Now!
View this answer and more for free by performing one of the following actions

Scan the QR code to install the App and get 2 free unlocks

Unlock quizzes for free by uploading documents