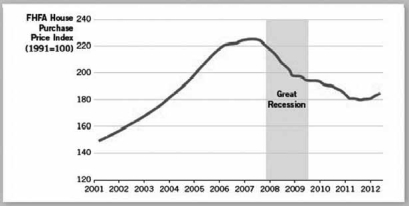
The graph below suggests a housing price_____ followed by a(n) _____ in aggregate demand. 
A) glut; decrease
B) bubble; increase
C) bubble; decrease
D) glut; increase
E) assessment; decrease
Correct Answer:
Verified
Q108: Which of the following economic statements would
Q111: Keynesian economists believe that prices are sticky
Q118: Based on the belief that prices are
Q120: If a Keynesian economist were asked to
Q124: Use the following graph to answer the
Q125: Keynesian economists believe that savings is a
Q130: Aside from what occurred with the Great
Q136: Use the following graph to answer the
Q137: Use the following graph to answer the
Q138: Use the following graph to answer the
Unlock this Answer For Free Now!
View this answer and more for free by performing one of the following actions

Scan the QR code to install the App and get 2 free unlocks

Unlock quizzes for free by uploading documents