Which of the following diagrams represents a Laffer curve?
A) 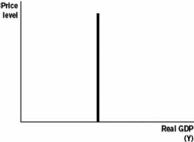
B) 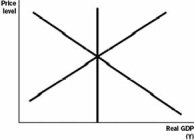
C) 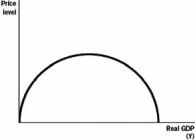
D) 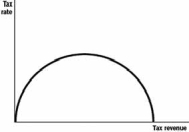
E) 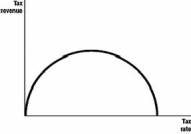
Correct Answer:
Verified
Q83: Lower corporate profit tax rates
A) will always
Q99: Supply-side fiscal policy initiatives take a long
Q101: In 1962,the marginal tax rates were as
Q104: Considering all U.S.taxpayers,average tax revenue paid (adjusted
Q105: At _ tax rates,_ in those tax
Q108: The Laffer curve is an
A) assertion that
Q114: A marginal tax rate of 91 percent
Q115: The Laffer curve shows that
A) tax revenue
Q117: Politicians who always advocate for tax rate
Q120: The y axis for the Laffer curve
Unlock this Answer For Free Now!
View this answer and more for free by performing one of the following actions

Scan the QR code to install the App and get 2 free unlocks

Unlock quizzes for free by uploading documents